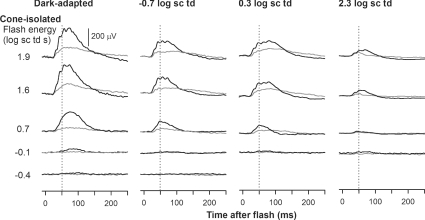
Figure 8. Effect of TTX on the cone-isolated ERG response for different background conditions.
Black traces represent cone-isolated ERGs produced by the paired-flash protocol (ISI = 800 ms) before TTX and grey traces represent those after TTX for four different backgrounds in four representative subjects.

