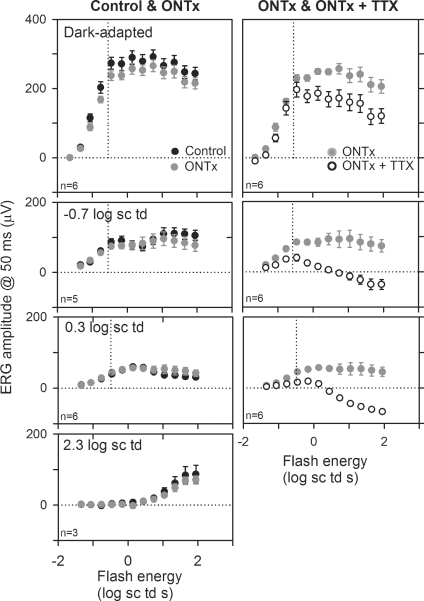
Figure 12. Effects of ONTx and ONTx + TTX on ERG amplitudes.
Left column: ERG amplitudes (measured at 50 ms after the brief flash) (group mean ± s.e.m.) plotted as a function of stimulus energy for the ONTx eye (grey circles) and the fellow control eye (black circles) for the dark-adapted condition and backgrounds of −0.7, 0.3 and 2.3 log sc td (top to bottom). Right column: ERG amplitudes (group mean ± s.e.m.) plotted as a function of stimulus energy for the ONTx eye (grey circles) and after ONTx + TTX (white circles). The vertical dotted line represents the flash energy that produces 10 μV of the maximum cone-isolated ERG amplitude measured at 50 ms for each condition of background illumination.

