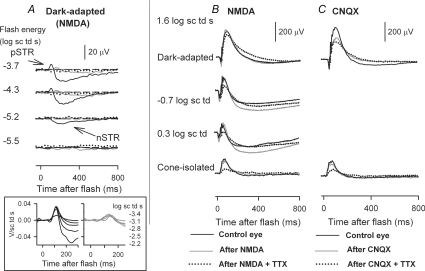
Figure 13. Effects of TTX on the ERG following suppression of inner retinal activity.
Black traces indicate control responses before injection of pharmacological agents, grey traces, after NMDA, and dotted black traces after TTX and NMDA (NMDA + TTX) for the same eye. A, ERG responses to low energy flashes (from bottom to top: –5.5 to –3.7 log sc td s) to show the effects of NMDA (grey lines) and NMDA + TTX (dotted lines) on the negative scotopic threshold response (nSTR) and the positive STR (pSTR). The inset at the bottom shows energy-scaled responses for the indicated flash energies. Scaling each response by dividing by the stimulus energy used to produce it showed that responses after NMDA (right plot) were superimposed, and less sensitive than the positive- and negative-going response before NMDA (left). These findings are consistent with isolation of a single component (PII, the rod bipolar cell component) after NMDA. In the control records (left) both positive and negative STRs were present, as well as a less sensitive response to the strongest stimulus (–2.2 log sc td) that looked similar to the responses after NMDA. For more details of this type of analysis see Robson & Frishman (1995) and Robson et al. (2004). B, top to bottom, ERG responses to a high energy flash (1.6 log sc td s) for dark-adapted conditions, mesopic conditions, and under dark-adapted conditions when cone responses were isolated. A, effect of CNQX and TTX after CNQX on the dark- and cone-isolated ERG response to the same high energy flash (1.6 log sc td s). Data traces analysed in Mojumder et al. (2007), but not illustrated.

