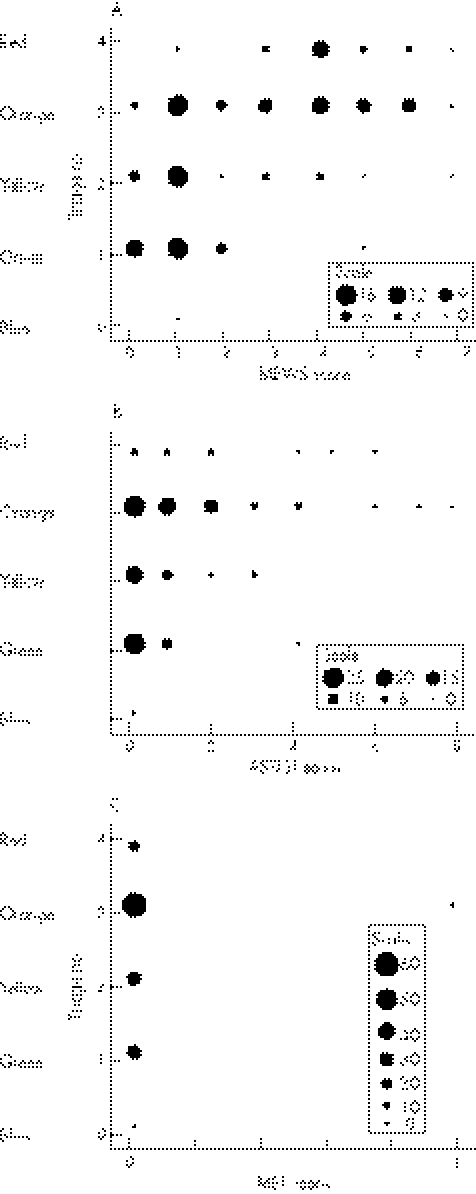
Figure 2 Scatter graph of categories for MTS and score for physiological triage systems across all three patient groups. The size of the dots represents the number of cases in each category. (A) MTS versus MEWS. (B) MTS versus ASSIST. (C) MTS versus MET. ASSIST, Assessment Score for Sick patient Identification and Step‐up in Treatment; MET, medical emergency team; MEWS, Modified Early Warning Score; MTS, Manchester Triage System.

An official website of the United States government
Here's how you know
Official websites use .gov
A
.gov website belongs to an official
government organization in the United States.
Secure .gov websites use HTTPS
A lock (
) or https:// means you've safely
connected to the .gov website. Share sensitive
information only on official, secure websites.
