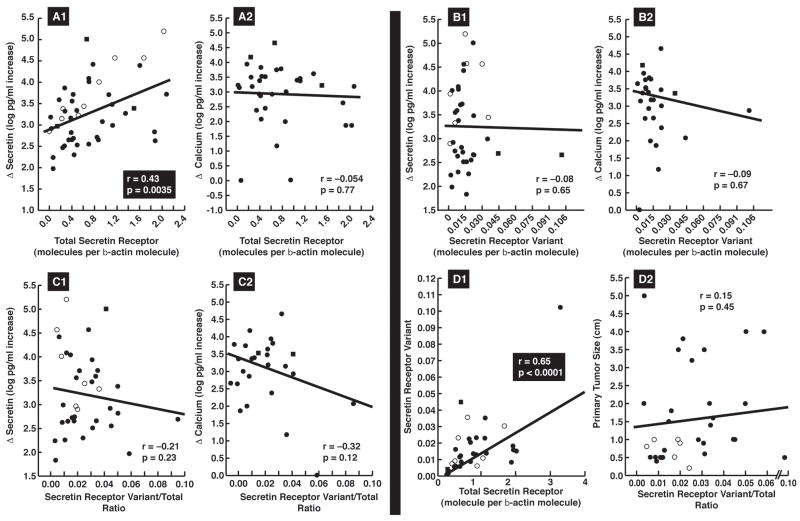
Figure 2.
Correlation of total-secretin-receptor and secretin-variant expression and their ratio with results of secretin and calcium provocative testing (A, B, C) and with each other (D1) or with tumor size (D2)., Each dot indicates the results from a gastrinoma from one patient and each value is the mean of at least three separate PCR determinations. Correlation coefficients and significance were determined by least-square analysis.). The different symbols indicate the source of the tumor analyzed in each case. Symbols: ● Primary-sporadic, ○Primary-MEN1, ■LN-sporadic, □LN-MEN1, ▲Liver metastases

