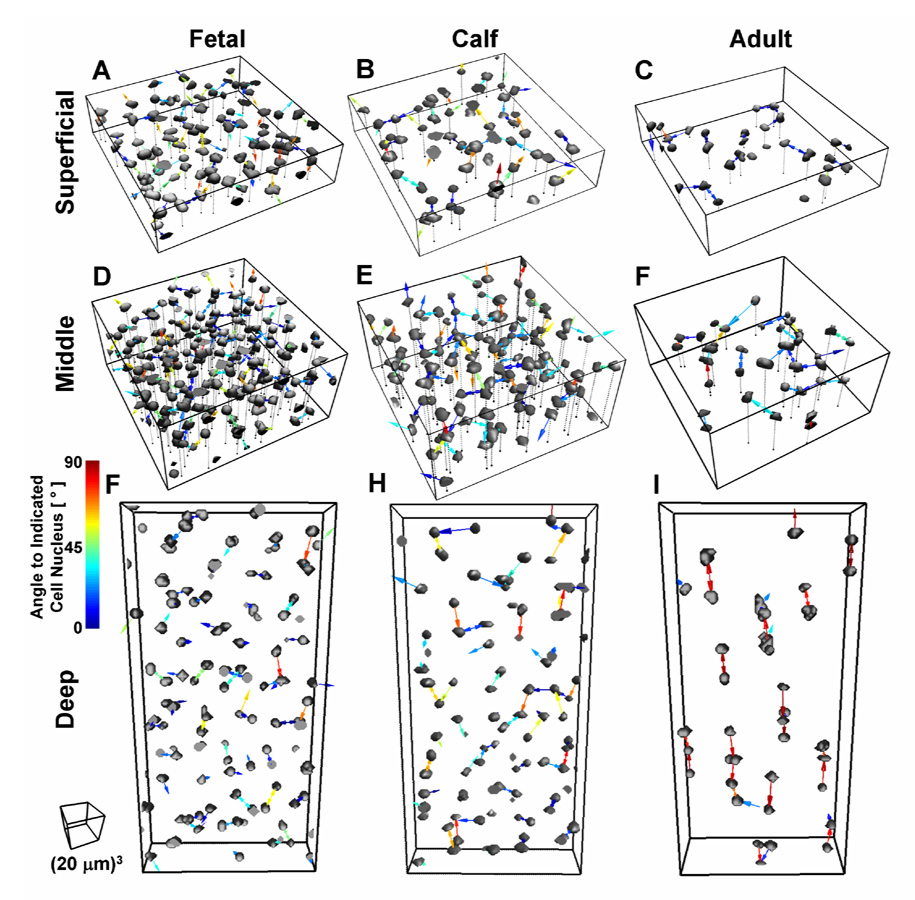
Figure 2.
Renders of isolated cell nuclei depicting cell organization highlighted by nearest neighbor vectors. The angle of vector in the z direction relative to the x/y plane is indicated by the color legend from 0–90°. Data presented for fetal, calf, and adult tissue in subsets of the superficial (0–100 µm), middle (100–200 µm) and deep (400–600 µm) tissue regions.

