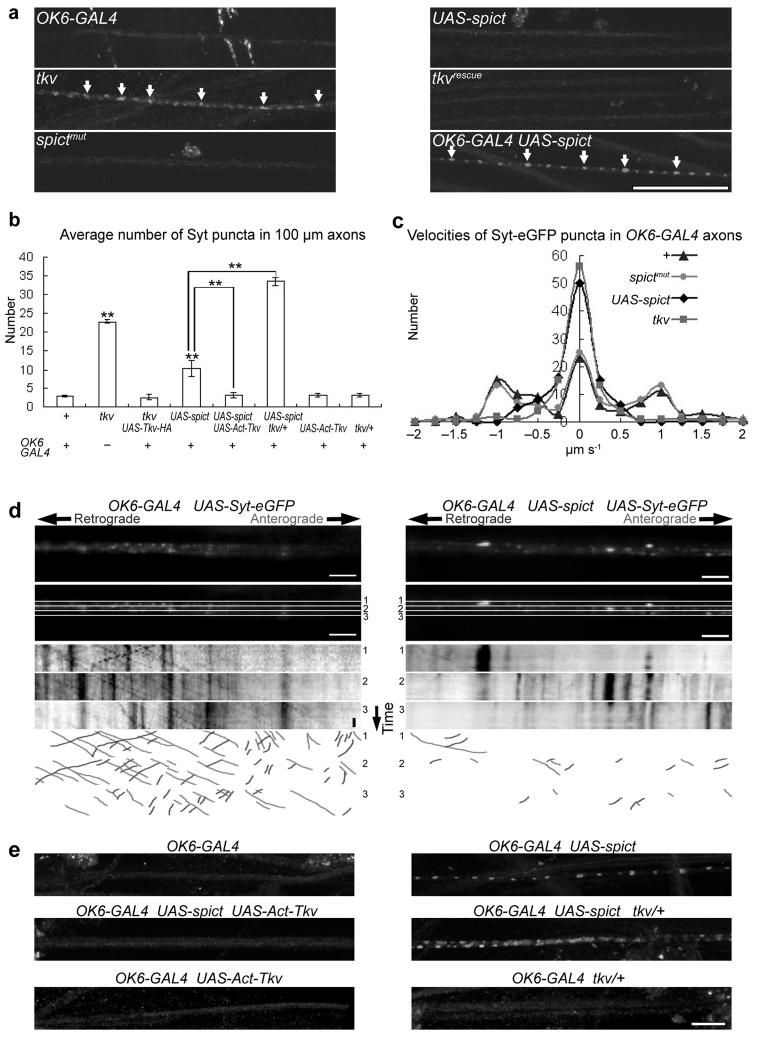
Figure 5. Spict-overexpression and tkv mutants impair fast axonal transport.
(a) Accumulation of synaptotagmin (arrows) in segmental nerves passing through segment A4. tkv genotypes are as in Fig. 4. (b) Quantification of synaptotagmin puncta in 100-μm lengths of segmental nerves of genotypes shown in a and e. Comparisons are with OK6-GAL4 (left bar) unless indicated. n=5 larvae. (c) Average velocities of 100 Syt-eGFP puncta, recorded over 60 seconds. Anterograde movements are positive, retrograde movements negative. Average speeds of labeled vesicles are significantly lower in tkv (P < 0.001) and Spict-overexpressing (P < 0.001), but not in spictmut larvae (P = 0.4) compared to in wild-type larvae (n=100 vesicles from 10 larvae in all genotypes). (d) The top row shows one frame from a time-lapse movie of Syt-eGFP-labeled vesicle transport in a segmental nerve of each genotype. For generation of kymographs, the segmental nerve was divided into substacks numbered 1-3 (second row). Kymographs of synaptic vesicle transport in the individual substacks are shown in the third to fifth rows. Moving vesicles appear as diagonal lines, and stationary vesicles as vertical lines. Individual vesicles can be identified by their characteristic intensities and sizes. The vertical scale bar represents 10 seconds. The lower three rows show lines drawn by hand to illustrate the types of movement analyzed. (e) Effects of BMP signaling on the axonal accumulation of synaptotagmin caused by Spict overexpression. Quantification is in b. Scale bars, (a), 50 μm; (d, e), 10 μm.

