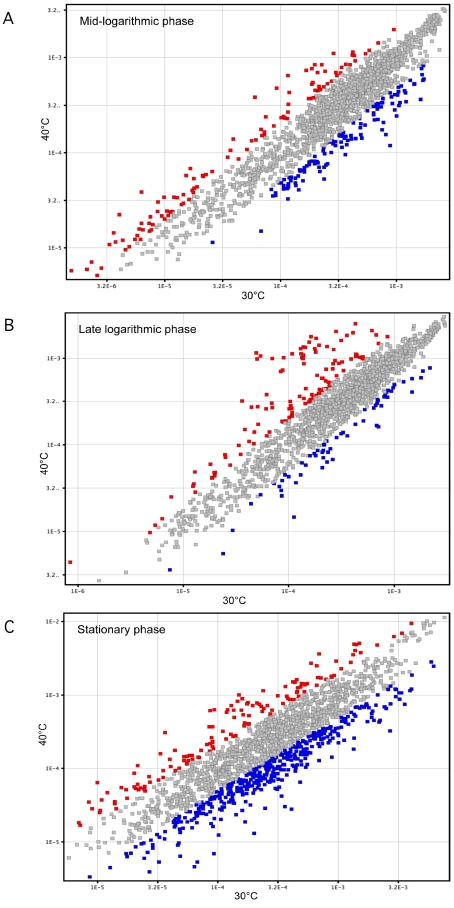
Figure 3. Expression of the 1,995 genes.
The scatter diagrams display normalized spot intensities of the microarray analysis from GBS strain NEM316 incubated at 30°C (horizontal axis) and 40°C (vertical axis). Genes significantly up-regulated 2-fold or more at 40°C relative to 30°C are in red, and genes up-regulated 2-fold or more at 30°C relative to 40°C are in blue. Only genes for which a statistically significant difference (P<0.05) was observed are indicated for (A) mid-logarithmic phase, (B) late logarithmic phase, and (C) stationary phase.

