
Fig. 1.
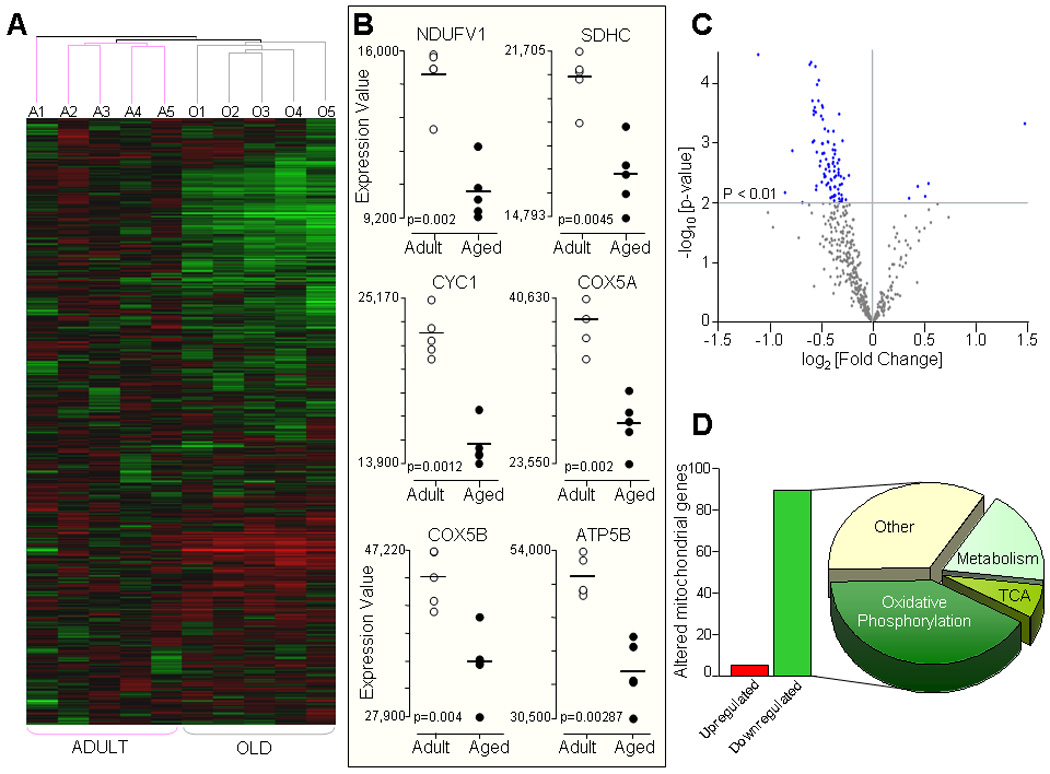
Aging-associated alterations in mitochondrial gene transcripts. A) Hierarchical clustering and heat map of samples from adult (6 month old, n=5) and aged (24 month old, n=5) rat ventricles. Shown are the expression pattern of 614 genes coding for mitochondrial proteins where Green color indicates downregulation, Red color upregulation, and Black color no change in the level of expression of genes. Samples from adult (Pink line) and aged (Gray line) animals clustered together as illustrated by condition tree (A1–A5 adult, O1–O5 aged samples). B) Expression values for selected genes coding for subunits of the mitochondrial OxPhos complexes from adult (n=5, White dots) and aged (n=5, Black dots) ventricles are shown as dot-plots highlighting the clustering of gene expression within each age group with the statistical significance of age-related changes between the two groups shown with their p values. C) Volcano plot illustrating the statistical distribution of 614 genes in aged compared with adult ventricles. There are 94 genes that were significantly different (p < 0.01) in the aged compared to adults (Blue dots). D) Number of significantly downregulated (89 genes, Green bar) and upregulated genes (5 genes, Red bar) in the aged heart and distribution according to their molecular function; 65% changes in genes coding for mitochondrial energetic pathways (41% for oxidative phosphorylation, 18% for substrate metabolism pathways and 6% for TCA cycle) and remaining 35% for other mitochondrial functions.