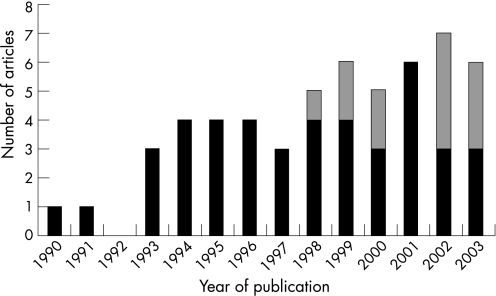
Figure 1 The number of included articles by year of publication. (A total of 55 articles were published in 1990–2003; the two articles from 2004 are not included in this graph since the database searches were conducted in June 2004.) Black bars: studies conducted in the USA; grey bars: studies conducted outside the USA.

An official website of the United States government
Here's how you know
Official websites use .gov
A
.gov website belongs to an official
government organization in the United States.
Secure .gov websites use HTTPS
A lock (
) or https:// means you've safely
connected to the .gov website. Share sensitive
information only on official, secure websites.
