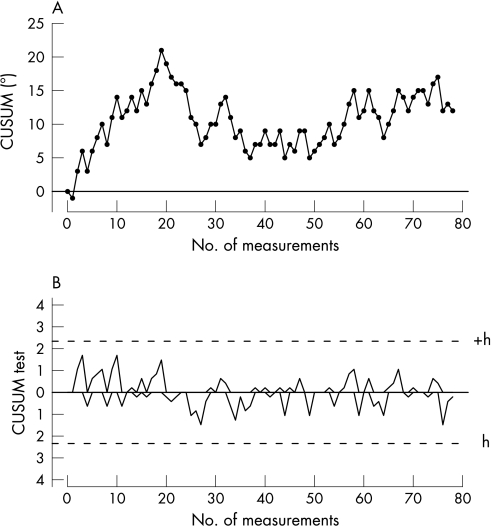
Figure 1 (A) A CUSUM graph and (B) a CUSUM test for monitoring limb alignment of total knee replacement using CT‐based navigation system.8 The CUSUM graph shows that learning curve lasted for the first 27 implants and then stabilised around the 180° axis (the target value). The CUSUM test shows that control of the process was maintained during the entire study. As limb alignment may deviate above or below the target value, two CUSUM tests (one positive and one negative) are drawn simultaneously with symmetric definition. Each has a control limit set at 3.6 (+ or −depending on the CUSUM) and the same holding barrier at 0.

An official website of the United States government
Here's how you know
Official websites use .gov
A
.gov website belongs to an official
government organization in the United States.
Secure .gov websites use HTTPS
A lock (
) or https:// means you've safely
connected to the .gov website. Share sensitive
information only on official, secure websites.
