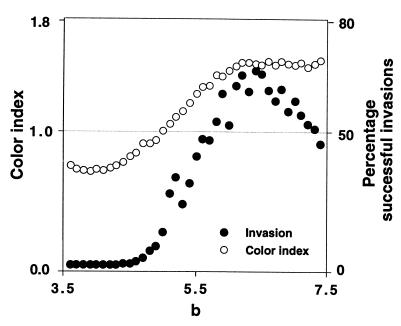
Figure 3.
Success of TFT invasion attempts in relation to the power spectrum of the dynamics of the resident AD population. For a range of b values in Eq. 4, we calculated the power spectrum and the color index of the corresponding stochastic time series. For low b, the color index is <1 and indicates high frequency dominance. As the competition parameter b is increased, the color index increases above 1, which indicates red spectra. The solid circles show the percentage of successful TFT invasion attempts into a resident AD population exhibiting the dynamics corresponding to each b value. The invasion scenario was run 1,000 times for 1,000 generations for a given value of b. The computations were done for 41 equally spaced b values in the interval [3.5,7.5]. For low values of b, both dynamic features that allow invasion, long periods of low population size and population crashes, tend to be absent. For higher values of b, both features tend to be present. Invasion of TFT starts to be likely for values of b > 4.5, which is almost exactly the point at which the color index of the resident AD population increases above 1. The parameters for the figure were the same as in Fig. 2A, except that b was varied as described. In addition, we adjusted the parameter a in Eq. 4 so that the equilibrium density of the resident population was equal to 250 for all values of b. The parameter a does not influence the qualitative dynamic behavior of Eq. 4 (8) and hence does not influence the power spectra of the time series. The percentages of successful invasion attempts for high b depend on the mutation rate and on the length of the resident time series over which invasion was tested (here 1,000 generations). However, qualitatively, the shape of the invasion curve (solid circles) does not depend on these parameters.

