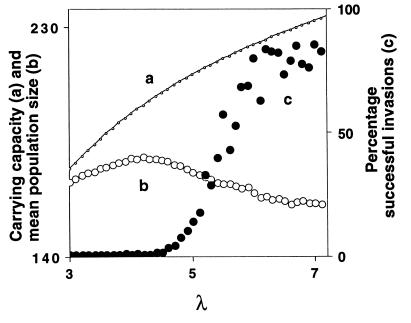
Figure 4.
Carrying capacity, mean density, and invasion success as a function of λ for fixed a and b. The carrying capacity N* is defined by F(N*) = 1 in Eq. 5, and hence is given by N* = [ln(λ)]1/b/a. Even though the carrying capacity increases with increasing λ (curve a), the mean density (calculated as the arithmetic mean of the densities that the resident AD population attains in the course of 10,000 generations) decreases as λ and hence the complexity in the system increases (curve b). The decrease in the mean population size reflects an increasing asymmetry in the distribution of population sizes over time (i.e. in the invariant measure), which is increasingly skewed to lower population sizes, even though the maximal population size attained by the resident in a particular time series increases as the carrying capacity increases (data not shown). As a consequence of this asymmetry invasion success of TFT increases with λ (curve c). To calculate invasion success, we used the same procedure as for Fig. 3 for fixed a = 0.006 and b = 2, and for 43 equidistant values of λ in the interval [3, 7.2]. The boundaries of this interval were chosen such that the resident dynamics are unstable, but such that the fluctuations in the system are not unrealistically large. As λ increases, the complexity and the fluctuations in the system and hence the chance of a severe population crash increase.

