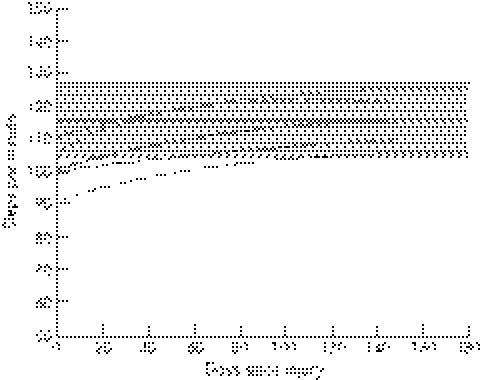
Figure 2 Recovery of gait cadence over time for the three functional subgroups and the mean recovery of all the anterior cruciate ligament deficient subjects. The ACLD group as a whole is indicated by the solid curved line with 1 standard deviation indicated by the thinner solid lines. ACL copers are indicated by the dashed line; adapters by the dotted line and non‐copers by the dot dashed line. The reference values derived from the control group (average±1 standard deviation) are indicated by the horizontal line with grey band.

An official website of the United States government
Here's how you know
Official websites use .gov
A
.gov website belongs to an official
government organization in the United States.
Secure .gov websites use HTTPS
A lock (
) or https:// means you've safely
connected to the .gov website. Share sensitive
information only on official, secure websites.
