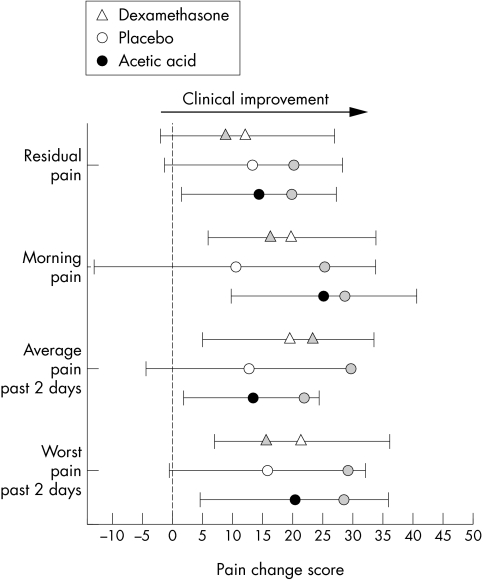
Figure 3 Pain change score responses (mean and 95% confidence interval) from initial assessment to four week follow up for the three treatment groups. All scores are related to a 10 cm visual analogue scale, and positive changes reflect clinical benefit. Grey markers show status at the end of the two week intervention showing level of maintenance/loss of clinical effect. Note that placebo/taping tended to show greatest loss of clinical benefits.

An official website of the United States government
Here's how you know
Official websites use .gov
A
.gov website belongs to an official
government organization in the United States.
Secure .gov websites use HTTPS
A lock (
) or https:// means you've safely
connected to the .gov website. Share sensitive
information only on official, secure websites.
