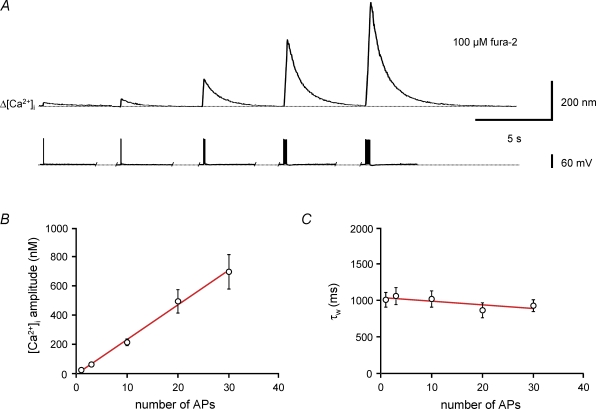
Figure 3. Linear summation of Ca2+ transients evoked by different numbers of action potentials.
A, Ca2+ transients in the apical dendrite of a BC filled with 100 μm fura-2 evoked by a single AP or 100 Hz bursts of 3, 10, 20 and 30 APs. Upper traces, averages of 20 sweeps; lower traces, corresponding APs and trains of APs evoked by brief current pulses. B, plot of peak amplitude of Ca2+ transients against the number of APs. Continuous curve represents the results of linear regression, yielding a steepness of 24 nm AP−1. C, plot of amplitude-weighted decay time constant (τw) of the Ca2+ transients against the number of APs. Note that τw is almost independent of the number of spikes. Continuous curve represents the results of linear regression, yielding a steepness of −5 ms AP−1. Data from 18 BCs loaded with 100 μm fura-2.

