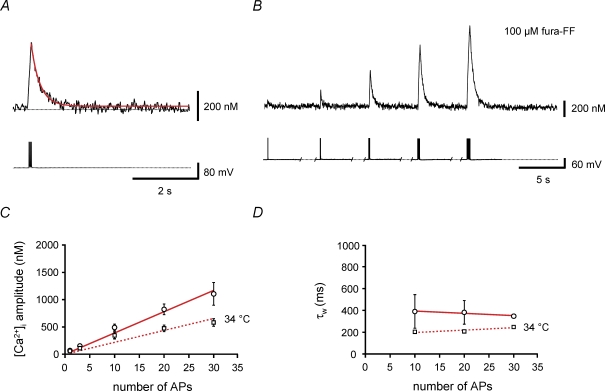
Figure 6. Direct measurement of the amplitude of Ca2+ transients and the Ca2+ extrusion rate with the low-affinity indicator fura-FF.
A and B, Ca2+ transients recorded in the proximal apical dendrite of a BC filled with 100 μm fura-FF. Upper traces, average Ca2+ transients (mean of 10 sweeps); lower traces, corresponding APs evoked by brief current pulses. A, Ca2+ transients evoked by a 100 Hz train of 10 APs; B, Ca2+ transients evoked by a single AP or 100 Hz trains of 3, 10, 20 and 30 APs. C, plot of peak amplitude of Ca2+ transients against the number of APs. ○, data obtained at 22–24°C; □, measurements taken at 34°C. Continuous and dashed lines represent the results of linear regression analysis of the two data sets, yielding steepness values of 39 nm AP−1 and 22 nm AP−1, respectively. D, plot of amplitude-weighted decay time constant (τw) of the Ca2+ transients against the number of APs. Data for 1 and 3 APs were omitted, because decay time constants could not be measured reliably. Note that τw is almost independent of the number of APs used as stimulus. ○, data obtained at 22–24°C; □, measurements taken at 34°C. Continuous and dashed lines represent the results of linear regression, yielding steepness values of −2.2 ms AP−1 and 2.2 ms AP−1, respectively. Data from 7 BCs (22–24°C) and 12 BCs (34°C) filled with 100 μm fura-FF.

