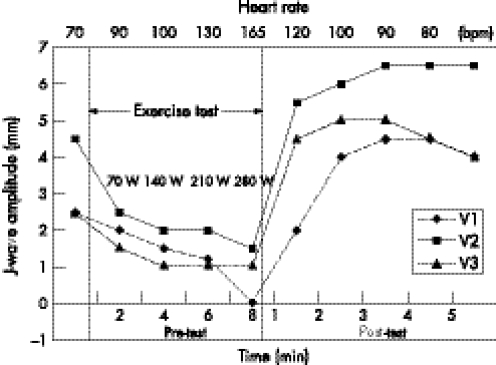
Figure 2 Time course of J‐wave amplitudes in the right precordial leads, before, during and after exercise testing. Note that the time scale (lower abscissa) referring to the exercise period is indicated in 2 min steps, whereas for the pre‐ and post‐test (post) period it is given in 1 min steps. The numbers on top (upper abscissa) represent mean heart rate; the inserted figures represent the work load in watts.

An official website of the United States government
Here's how you know
Official websites use .gov
A
.gov website belongs to an official
government organization in the United States.
Secure .gov websites use HTTPS
A lock (
) or https:// means you've safely
connected to the .gov website. Share sensitive
information only on official, secure websites.
