
Figure 2.
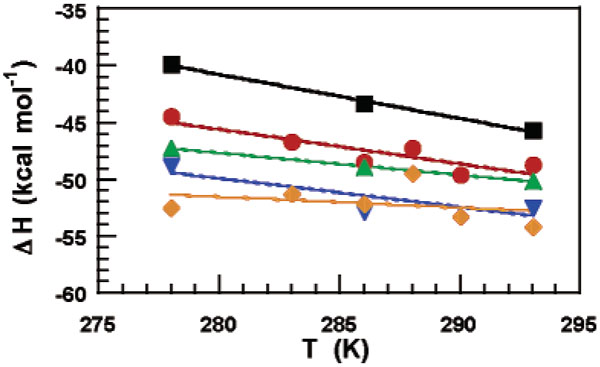
Plot of ΔH versus temperature used to determine ΔCP for duplex 1 formation in 50 mM HEPES, pH 7.5 as a function of added NaCl: 100 mM (orange ♦), 300 mM (green ▲), 500 mM (blue ▼), 1 M (red ●), 1.5 M (black ■). Data points are the mean of three independent trials.