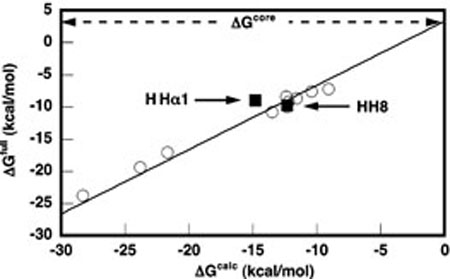
FIGURE 3.
ΔGfull for HHαl and HH8 (closed squares) as determined by ITC, plotted against ΔGcalc for the same constructs as predicted by the independent nearest neighbor-hydrogen bonding (INN-HB) model (30). The data are overlaid on a plot of the complete dataset (open circles) generated by Hertel et al. (20), correlating ΔGfull as determined largely from cleavage kinetics with ΔGcalc from the INN-HB model for a set of 10 bimolecular hammerhead ribozyme constructs. The previous dataset is fit to a line with a slope of 1 and an intercept of +3.3 kcal mol−1, corresponding to ΔGcore. All data reflect measurements conducted at 25 °C in 50 mM HEPES pH 7.5, 10 mM MgCl2.

