
Figure 7. TRPC3 channels in inside-out patches are not significantly affected by PIP2.
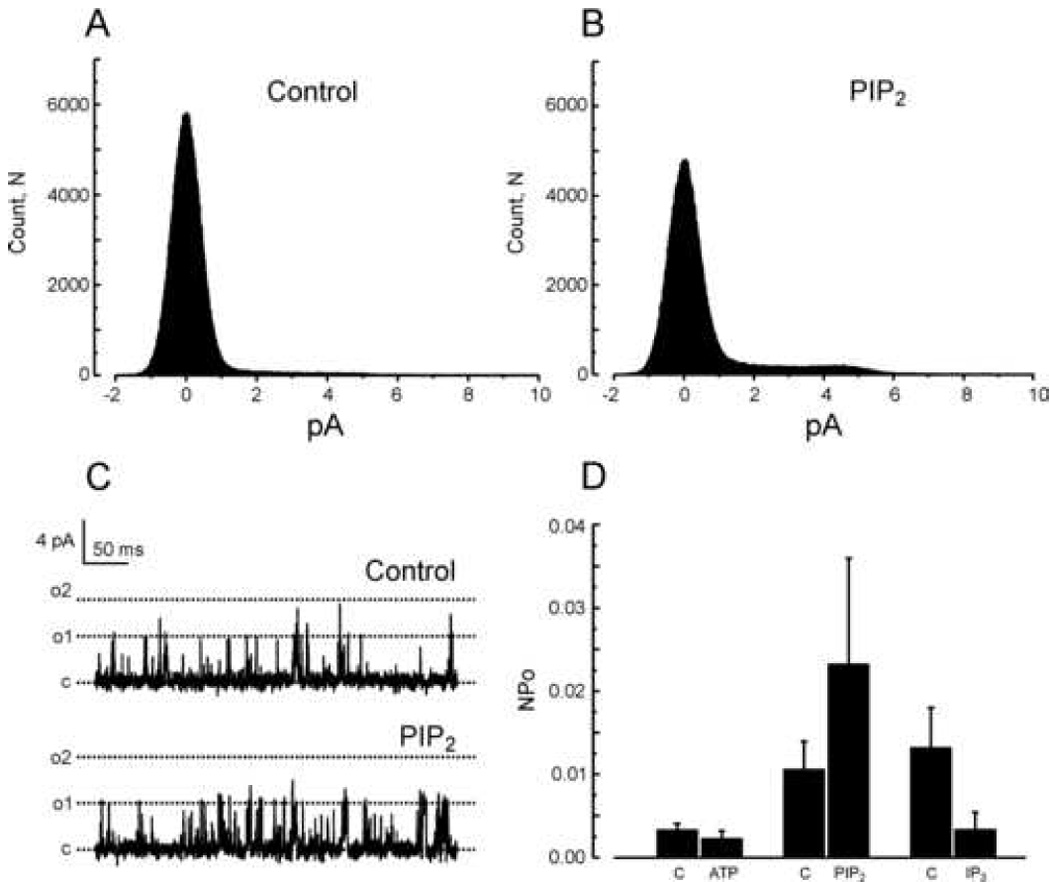
A and B: All-points histograms summarizing single channel amplitudes at +60 mV in the inside-out configuration before (A, Control) and after addition of 10 µM PIP2 (B, PIP2). C: Examples of TRPC3 currents recorded in an inside-out patch clamped at +60 mV and exposed to a regular (top panel) or a 10 µM PIP2-containing solution (bottom panel). “c” and “o” denote respectively the closed and open states. D: Histograms summarizing the variations of TRPC3 single channel activity at +60 mV in the inside-out configuration when challenged with 1 mM MgATP (n=5 patches), 10 µM PIP2 (n=10 patches) or 10 µM IP3 (n=5 patches). Results are presented as mean ± SE.