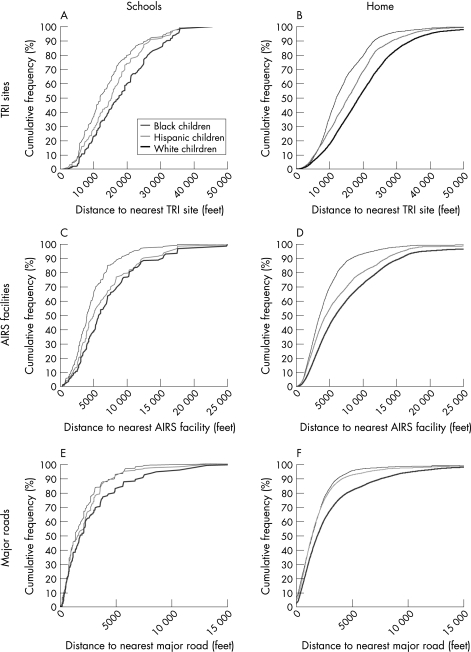
Figure 2 Cumulative distribution functions of exposure potential of school children. The vertical axis in each graph depicts the cumulative number of children as a percentage of the group total. The horizontal axis in each graph depicts the distance to the nearest pollution source. AIRS, aerometric information retrieval system; TRI, toxic release inventory.

An official website of the United States government
Here's how you know
Official websites use .gov
A
.gov website belongs to an official
government organization in the United States.
Secure .gov websites use HTTPS
A lock (
) or https:// means you've safely
connected to the .gov website. Share sensitive
information only on official, secure websites.
