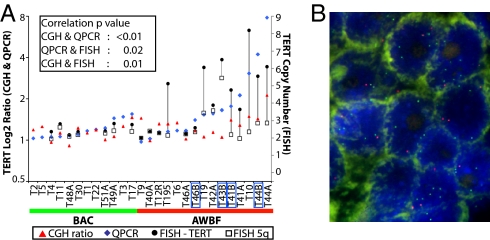
Fig. 4.
TERT validation by QPCR and FISH. (A) TERT content measured by array CGH and QPCR on genomic DNA (relative to normal control) and FISH (mean gene copy number per nucleus) show high correlation between the different methods. The black lines connecting copy number of TERT (filled circles) and 5q (open squares) are drawn to highlight the difference in copy number between the two probes. The blue boxes mark the AWBF sampled in invasive areas. Samples T41A, T44A, and T46A represent the BAC-like area, and T41B, T44B, and T46B represent the invasive area of AWBF. (B) FISH performed on AWBF in BAC area (sample T195) using the dual-color FISH probe mix that contains the hTERT locus (5p15, green signal) and the control D5S89 probe (5q31, red signal). Gain of TERT is reflected by the increased number of green compared with red foci.

