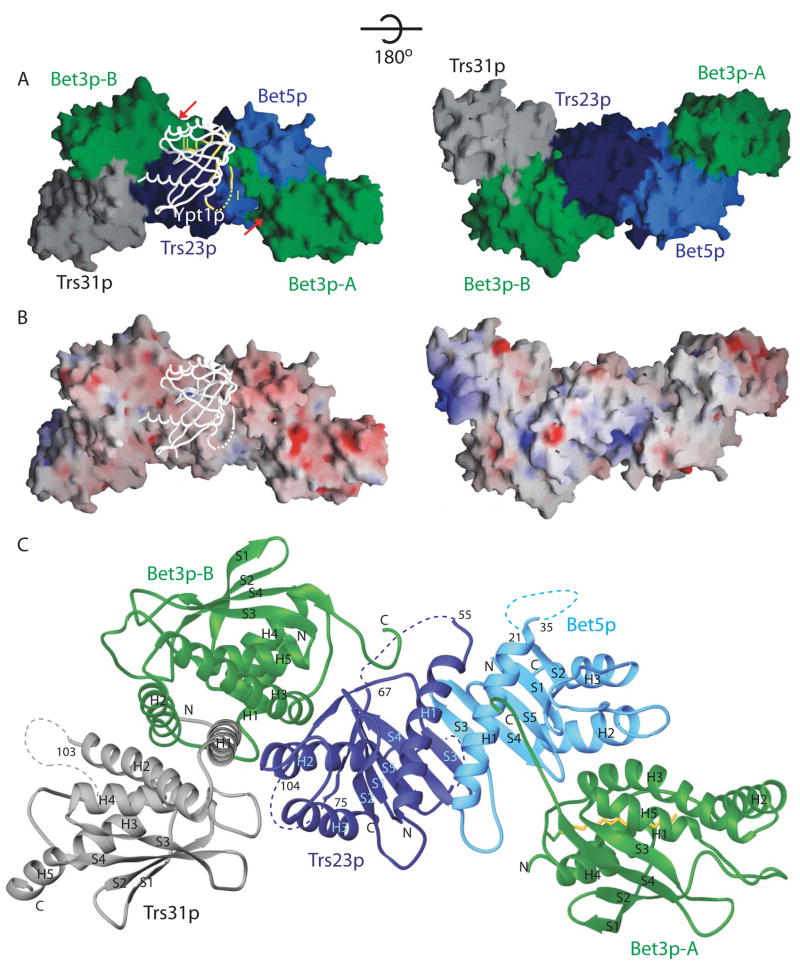
Figure 1.
Structure of Ypt1p bound to TRAPPI subcomplex. (A) The TRAPPI complex is shown as a surface representation, and Ypt1p is shown as a backbone worm. In TRAPPI, different polypeptide chains are colored differently. In Ypt1p, switch regions I and II are yellow. At left, the positions of Cys80 and the hydrophobic channels in the two copies of Bet3p are labeled with red arrows. The right panel shows the same complex rotated about the horizontal axis indicated. (B) A surface representation of TRAPPI colored by electrostatic potential (blue=basic; red=acidic), with Ypt1p shown as a backbone worm. The orientations of the protein complexes are identical in panels A and B. (C) A ribbons representation of TRAPPI oriented as in panel A, left. The palmitoylate group modeled into the Bet3p-A hydrophobic channel is yellow.

