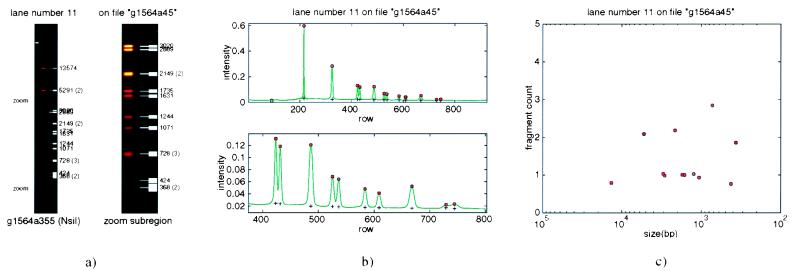
Figure 4.
Processing of agarose gel images. (a) False-color image of digest from lane 11 of the gel shown in Fig. 3. The full-lane image is shown (Left), and an intensity-rescaled image of the region demarcated by “zoom” is shown (Right). White bars point to bands that are automatically identified by the image-analysis software. Fragment sizes in base pairs are indicated, and any band multiplicities greater than one are given in parentheses. (b) One-dimensional representation of the full lane (Upper) and the zoom region (Lower). The collapse to one dimension is done with a median-biased averaging scheme. Each row is analyzed separately. Pixels are first sorted by intensity, and a fixed number of the lowest intensity pixels are eliminated to account for the gap between gel lanes. From the remainder, an average of the middle quartile is computed. (c) Fragment counts for the lane, which contains eight singlets, three doublets, and one triplet. Fragment count estimates are based on the trend in integrated band intensity versus fragment size. This trend is variable from gel to gel and is highly nonlinear. Every digest lane on the gel that has not been rejected because of bad data is analyzed simultaneously to build a composite trend line for the relationship between integrated intensity and DNA quantity.

