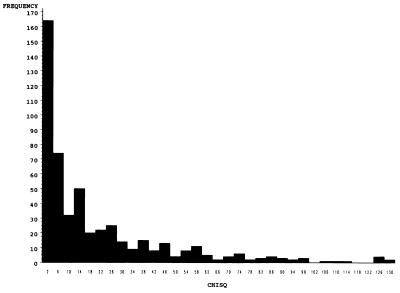
Figure 1.
Distribution of χ2 statistics obtained from a logistic regression analysis contrasting the frequency of clefting between all possible combinations of RI lines exposed to 6-AN. Type I error for the gene mapping hypothesis estimated as the proportion of χ2 statistics ≥ the statistic observed for each marker.

