Figure 4.
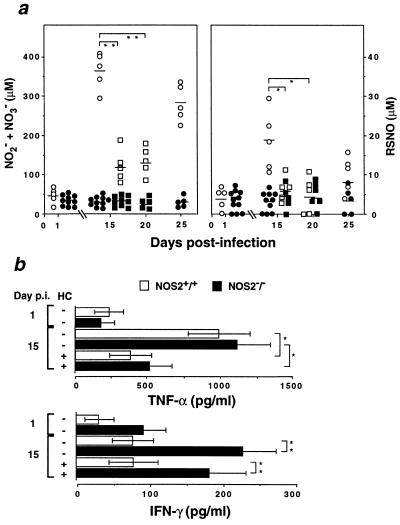
Suppressive effects of HC on inducible NO production and tuberculostatic cytokines. (a) Release of NO2− + NO3− and RSNO during the course of infection and the effects of HC on their secretion. Symbols are as in Fig. 3 and represent individual sera assayed in triplicate; horizontal bars denote group means. ∗, P < 0.01, ∗∗, P < 0.0001, unpaired t test. (b) Plasma TNF-α or IFN-γ responses (mean ± SEM) of PBS- and HC-treated mice determined in triplicate by ELISA. ∗, P < 0.048, ∗∗, P < 0.038.

