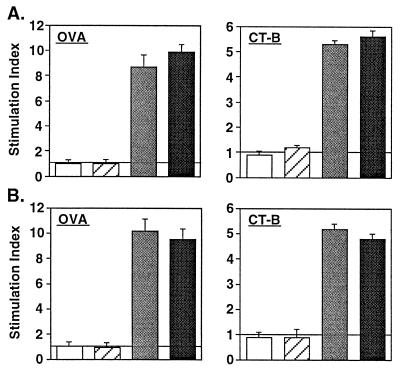
Figure 4.
OVA- and CT-B-specific CD4+ T cell proliferative responses isolated from lung (A) and spleen (B). Groups of C57BL/6 mice were immunized with 100 μg of OVA alone (□) or together with 10 μg of rCT-B (▨), 0.5 μg of nCT (░⃞), or 5 μg of mCT S61F (▪) on days 0, 7, and 14. Bars represent the mean stimulation index ± 1 SE and each group contained five mice. The data were similar and are representative of four separate experiments.

