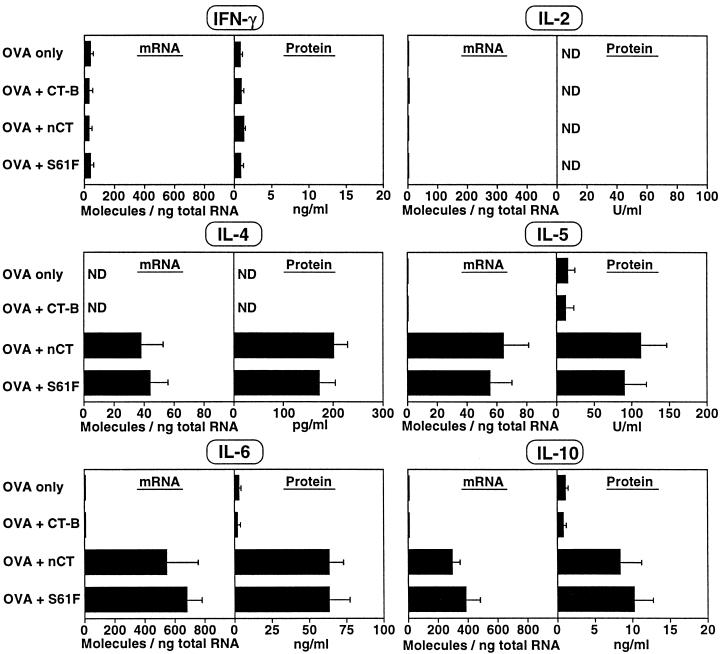
Figure 5.
Cytokine production from OVA-specific CD4+ T cells isolated from lung tissues. Molecules of cytokine-specific mRNA were determined by quantitative RT-PCR. Cytokine protein production was determined by ELISA. The scale of each figure corresponds to mRNA molecules and protein levels produced by nonimmunized CD4+ T cells stimulated with anti-CD3 mAb. ND, not detected; IFN-γ, interferon γ. Bars represent the mean cytokine profile ± 1 SE in each group. The data are representative of four separate experiments.

