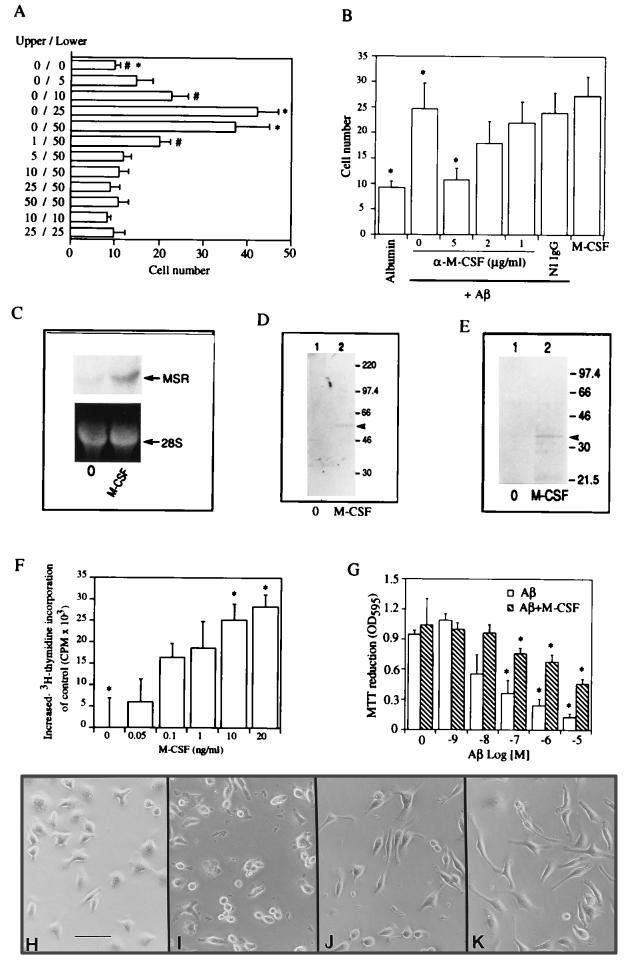
Figure 3.
M-CSF induces activation of BV-2 cells and enhances their survival in the presence of toxic levels of Aβ. (A) Chemotaxis of BV-2 cells was studied using microchemotaxis chambers: 1 × 10⁴ cells were added to the upper compartment and M-CSF (ng/ml) was added to the upper and/or lower compartment as indicated. After 1.5 hr at 37°C, cells reaching the lower surface of the chemotaxis chamber membrane were visualized with Wright’s stain and counted. Data are reported as cells per high-power field (HPF) based on counting nine fields per well. (B) Neuroblastoma cells (2 × 10⁶) were incubated with Aβ (1–40; 1 μM) or albumin (1 μM) immobilized on Amino Link Coupling gel for 8 hr at 37°C. Beads were removed by centrifugation, and the supernatant was used to perform chemotaxis assays as indicated in A (above). Where indicated, anti-M-CSF IgG (α-M-CSF; at the indicated concentration) or nonimmune IgG (5 μg/ml) was added. (C) BV-2 cells (3 × 10⁶) were exposed to medium alone (0) or medium containing M-CSF (50 ng/ml; M-CSF) for 72 hr at 37°C in Opti-MEM, and samples were harvested for Northern blot analysis using 32P-labeled cDNA probe for murine MSR. The lower panel shows ethidium bromide staining of the same gel, and demonstrates approximately equal loading of RNA. (D) BV-2 cells (3 × 10⁶ cells) were exposed to medium alone (0) or medium containing M-CSF (50 ng/ml) for 72 hr at 37°C, and samples were obtained for Western blot analysis (the latter utilized α-MSR IgG, as described in the text). Migration of simultaneously run molecular mass standards is shown on the side of the gel in kDa. (E) BV-2 cells were exposed to medium alone (0) or medium containing M-CSF (25 ng/ml), and cell lysates were prepared for reduced SDS/PAGE followed by immunoblotting using antibody to mouse apoE. The arrowhead indicates migration of the immunoreactive band in D and E). (F) BV-2 cells (5 × 10⁴ per well) were incubated in medium alone (0) or medium supplemented with M-CSF (the indicated concentration), and [3H]thymidine incorporation was determined. (G) BV-2 cells (as above) were incubated in medium alone (0) or medium supplemented with MCSF (50 ng/ml) and were exposed to Aβ (25–35) at the indicated concentrations for 24 hr. 3-(4,5-Dimethylthiazole-2-yl)-2,5-diphenyl tetrazolium bromide (MTT) reduction was determined 4 hr later. ∗, P < 0.01 or #, P < 0.05 compared with controls. (H–I) Photomicrographs of BV-2 cells incubated in medium alone (H), medium + Aβ (1–42; 2.5 μM) (I), medium + Aβ (1–42; 2.5 μM) + M-CSF (50 ng/ml) (J), or medium + M-CSF (50 ng/ml) (K) after 24 hr. (Bar = 200 μM.)

