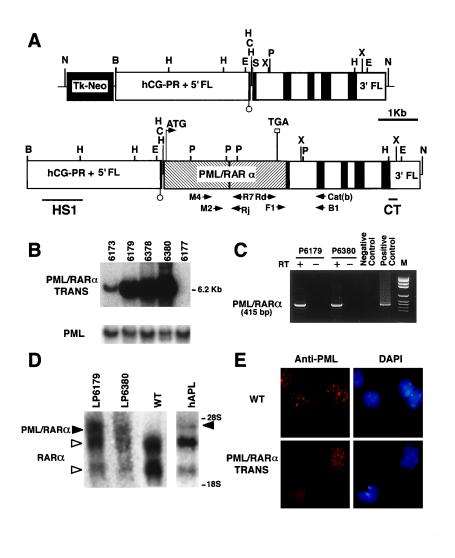
Figure 1.
Structure, integration, and expression of the hCG–PML/RARα transgene. (A) Structure of the hCG minigene expression vector (Upper) and the hCG–PML/RARα transgene fragment used for injection (Lower). The exons of hCG gene are designated by solid boxes. The promoter and the 5′ flanking region (hCG–PR + 5′ FL) as well as the 3′ flanking region (3′ FL) of the hCG gene are indicated. The PML/RARα cDNA was cloned into hCG exon 1. Restriction endonuclease sites used in construction and Southern blotting are as follows: N, NotI; B, BamHI; E, EcoRI; C, ClaI; S, SalI; P, PmlI; X, XbaI; H, HindIII. The location of probes for Southern blotting and primers for RT-PCR are shown underneath the structure of the injected fragment. (B) Southern blot of mouse genomic tail DNA from the four transgenic founders and one control digested with EcoRI and hybridized with probe CT reveals the expected band of 6.2 kb. PML probe A (see Materials and Methods) was used as an internal control probe to normalize DNA loading. Lanes: 6173, 6179, 6378, and 6380, four founders; 6177, nontransgenic mouse. (C) RT-PCR analysis of PML/RARα fusion mRNA expression in BM cells from progeny from founders 6179 (P6179) and 6380 (P6380). Representative result of nested PCR is shown. Negative control, RNA from a nontransgenic mouse; positive control, RNA from an APL patient with t(15;17); M, pGEM DNA markers (Promega). (D) Northern blot on total RNA from leukemic progeny from lines 6179 (LP6179) and 6380 (LP6380) hybridized with the human RARα probe IT (5). WT, nontransgenic mouse; hAPL, APL patient with t(15;17) [PML/RARα of bcr1 type (ref. 12)]. Expected 4.0-kb transcript for hCG–PML/RARα transgene (left solid arrowhead) and 4.4-kb transcript for human PML/RARα chimeric mRNA (right solid arrowhead) are indicated. Open arrowheads indicate the positions of the two RARα transcripts. The position of the 28S and the 18S ribosomal RNA transcripts are also indicated. (E) Immunofluorescence staining of BM cells from control mice (WT) and leukemic hCG–PML/RARα transgenic mice. PML is localized within the NBs in nontransgenic mouse (Upper), whereas it is in the form of microspeckles in transgenic mouse (Lower). 4′,6-Diamidino-2-phenylindole (DAPI) staining was used to visualize cell nuclei.

