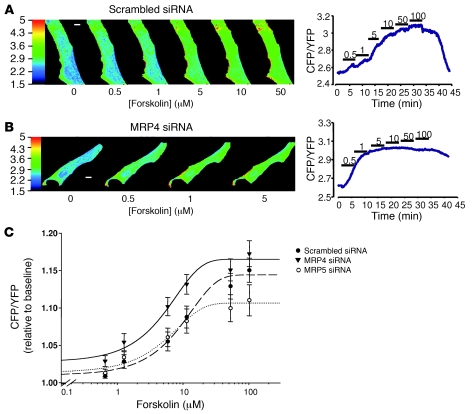
Figure 6. Real-time cAMP imaging in living cells.
Effect of forskolin superfused at increasing concentrations (from 0.5 μM to 100 μM) on intracellular cAMP measured with the FRET-based sensor Epac2-camps in 2 representative hCASMCs transfected with (A) scrambled or (B) MRP4 siRNA. Raw images were obtained upon CFP excitation at 440 ± 20 nm in both cells, and the time course of the corresponding cell average–corrected CFP/YFP ratio are reported. CFP and YFP fluorescence indicated that Epac2-camps was mainly located in the cytosol in both cells. In the scrambled siRNA–transfected cell (A), application of 5 μM forskolin increased cAMP, as reflected by the increase in the basal CFP/YFP ratio. In the MRP4 siRNA–transfected cell (B), forskolin concentration as low as 0.5 μM significantly increased cAMP. Scale bars: 10 μm. (C) Concentration-response curve (logarithmic scale) of FRET measurements in hCASMCs transfected with MRP4 siRNA (triangles, n = 11), MRP5 siRNA (open circles, n = 12), or scrambled siRNA (filled circles, n = 18) and transiently transfected with Epac2-camps. The basal CFP/YFP ratio was similar in the 3 groups of cells. Continuous lines are the fit of the data points to the Hill equation (see Methods). MRP4 RNA interference in hCASMCs resulted in a leftward shift of the forskolin concentration-response curve, as indicated by the significantly different EC50 values obtained for the drug in scrambled and MRP4 siRNA groups of experiments.

