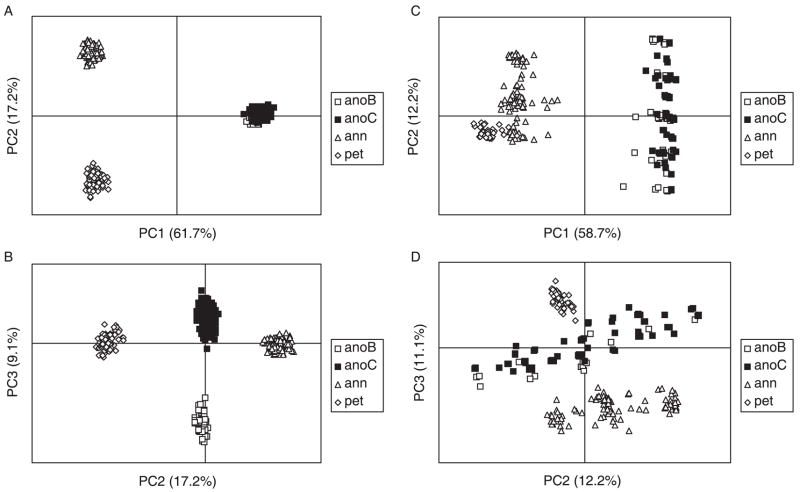
Fig. 2.
Principal Coordinate Analysis of individual plant genotypes. Axes titles include the percentage variance explained by that axis in parentheses. anoB, Helianthus anomalus, Hanksville area populations; anoC, H. anomalus, Little Sahara populations; ann, H. annuus; pet, H. petiolaris. A and B are plots for all loci, C and D are plots for only the six loci with significant reductions in variation.

