
Fig. 2.
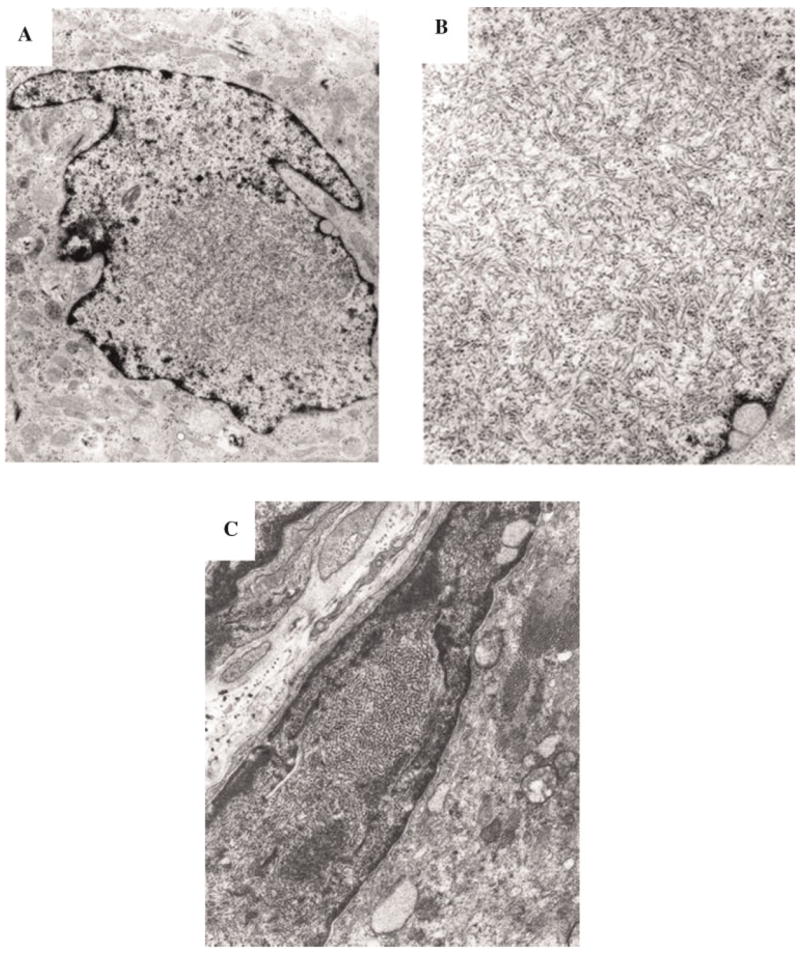
Electron microscopy of typical inclusions in IBMPFD muscle, compared with inclusions in Pagetic nuclei. A: Low magnification of inclusions in a nucleus of a Pagetic osteoclast (×20,000). B: High magnification of PHF in a nucleus of a Pagetic osteoclast (×40,000). C: Nuclei almost completely filled with collections of PHF (paired helical filaments), which appear as inclusions by light microscopy (×16,000).