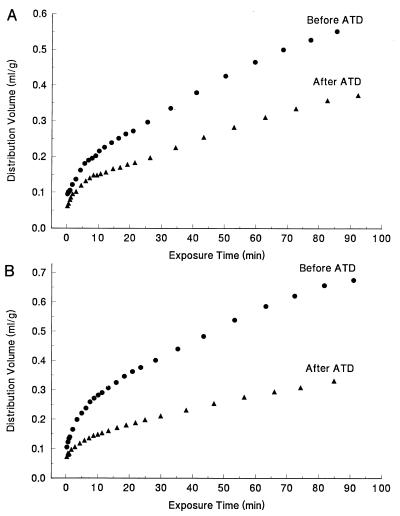
Figure 1.
A set of representative plots exemplifying the tissue distribution volume (ml/g) in the frontal cortex of a male (A) and female (B) subjects as a function of the exposure time θ [θ = ∫0T Cp*(t) dt/Cp*(T); min]. The upper curves in A and B were obtained at baseline, and the lower curves were obtained after tryptophan depletion.

