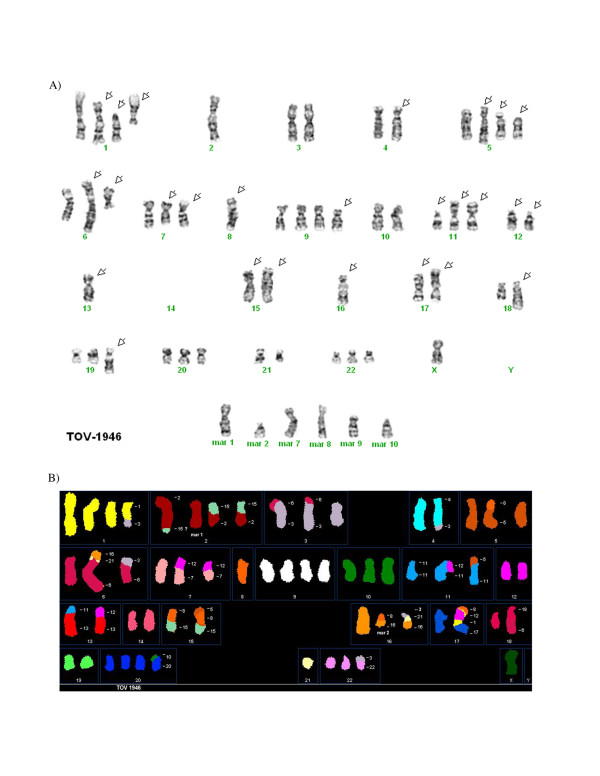
Figure 5.
A) Representative G-banded metaphases from the TOV-1946 (cell 34) cell lines. Arrows indicate the abnormal chromosomes, mar: marker chromosome. B), D), F) Representative metaphases from TOV-1946 (cell 44) cell line analyzed by SKY. The origin of several marker chromosomes (mar) is defined by SKY analysis. Other examples of G-banded metaphases and the combined inverted-DAPI and SKY images of different cells are presented (see additional Files 3 and 4).

