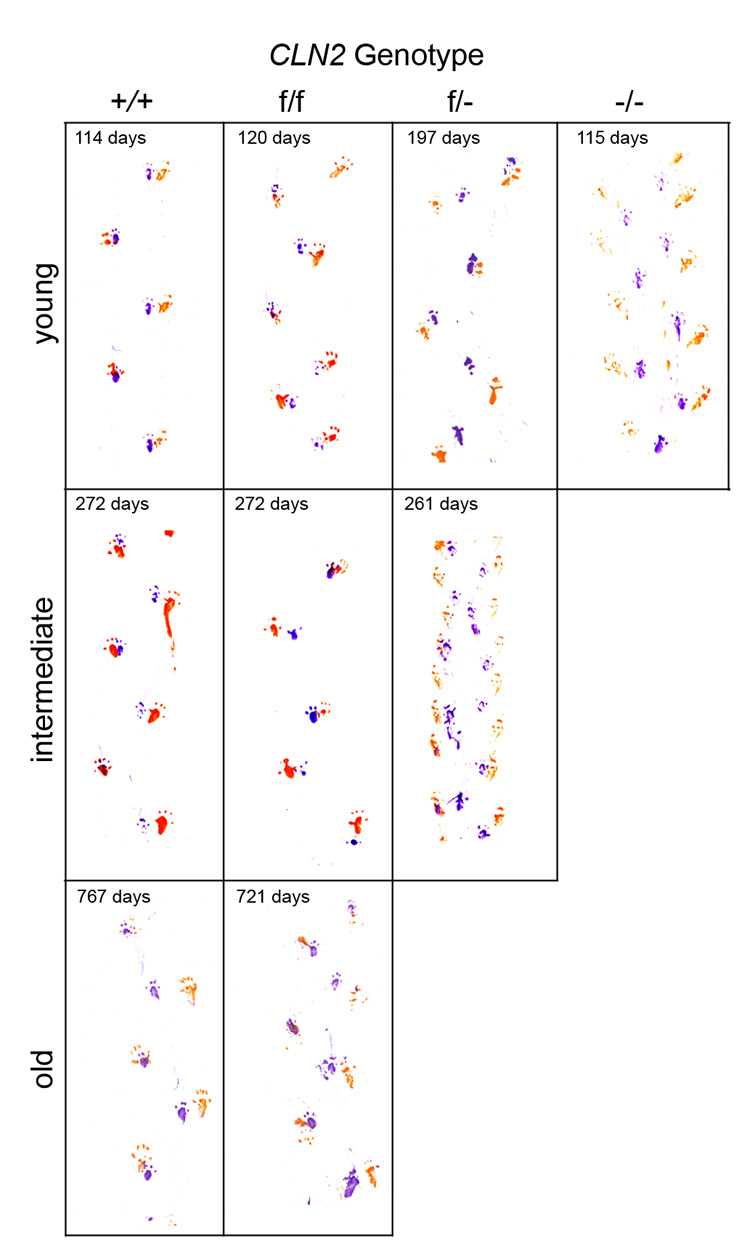
Figure 6. Gait analysis of CLN2 mutant mice.

Gait analysis was conducted on mutant and control mice (n=2 for each genotype at each timepoint) and representative patterns shown. Mice were either congenic or near congenic (≥ 6 backcrosses) C57BL/6.

Gait analysis was conducted on mutant and control mice (n=2 for each genotype at each timepoint) and representative patterns shown. Mice were either congenic or near congenic (≥ 6 backcrosses) C57BL/6.