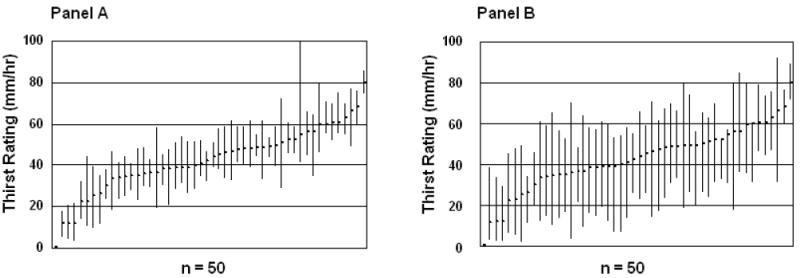
Figure 7.

Panel A - Range of mean daily thirst ratings (between 09:00 and 21:00 h) for each individual (n=50). Each plotted bar represents the highest and lowest daily mean thirst rating experienced over a consecutive 7-day period. Panel B - Mean of the ranges of daily thirst ratings (between 09:00 and 21:00 h) for each individual (n = 50). Each plotted bar represents the mean highest and lowest daily thirst rating experienced over a consecutive 7-day period.
