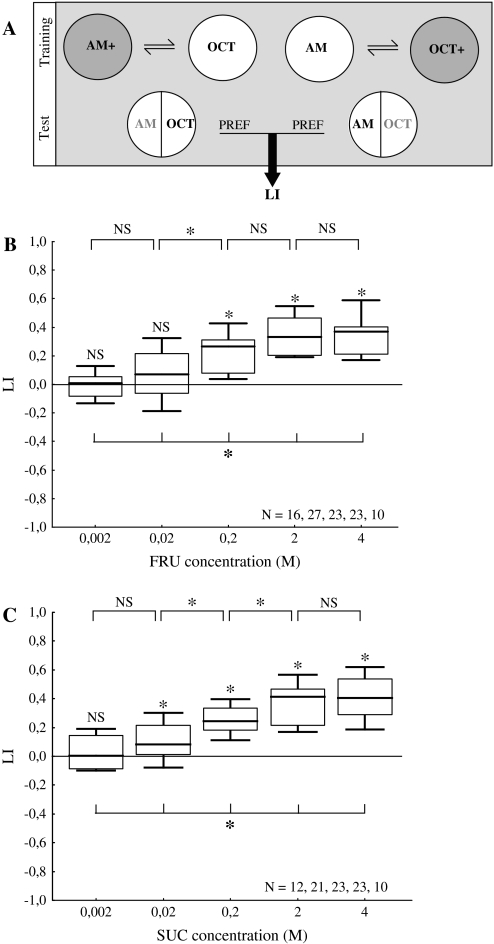
Figure 5.
Learning. (A) Groups of 30 larvae are trained with 2 odors (i.e., AM and OCT) and a reinforcer (i.e., either fructose: FRU or sucrose: SUC at the indicated concentration). One group of larvae receives AM while crawling on a reinforcer-containing agarose plate, whereas OCT is presented in the absence of the reinforcer (i.e., AM+/OCT training). Another group is trained reciprocally (AM/OCT+) (note that for half of the cases the sequence of trials is as indicated; in the other half, sequences are reversed: OCT/AM+ and OCT+/AM). After repeated training, both groups are tested for their preference between AM and OCT in a choice situation. Associative learning shows by higher preference scores for AM in the group trained AM+/OCT than in the reciprocally trained AM/OCT+ group. This difference is quantified by the LI. Positive LI values thus indicate appetitive learning. (B) The strength of fructose as a reinforcer depends on its concentration. Low concentrations of fructose do not support learning, whereas higher concentrations do. Learning gets stronger with increasing fructose concentration until it saturates between 0.2 M and 2 M. (C) Sucrose also has a concentration-dependent reinforcing effect. A low sucrose concentration does not support any learning, whereas higher concentrations do. Increasing sucrose concentration strengthens learning until an asymptote is reached at 2 M. For all-group comparisons, Kruskal–Wallis tests are used at P < 0.05; for follow-up pairwise comparisons, Mann–Whitney U tests are used at P < 0.05/4; for single-group comparisons against zero, 1-sample sign tests are used at P < 0.05/5. For details concerning the box plots, see the caption of Figure 1.

