
Fig. 2.
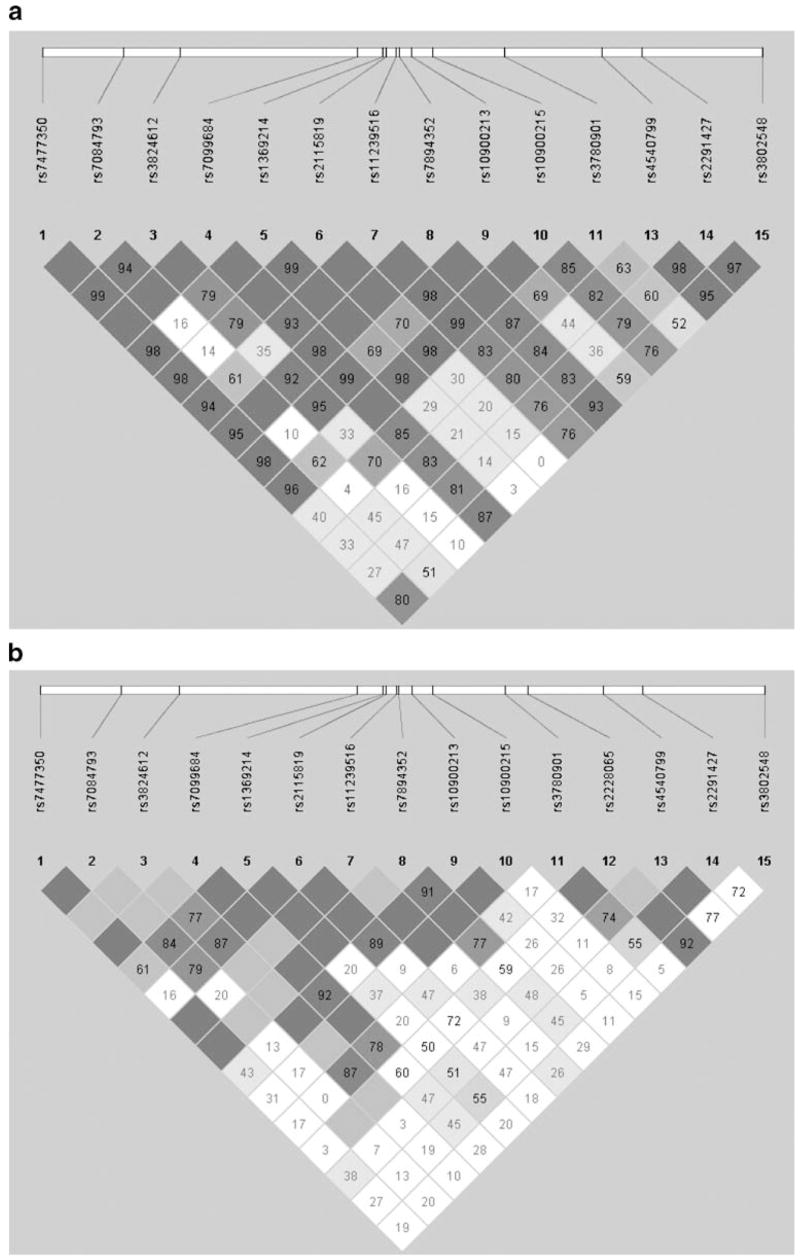
Linkage disequilibrium (LD) computed between the genotyped SNPs in ALOX5. The pair-wise D′ statistic is shown within each box (range 0–100; 0 indicating no LD; 100 indicating complete LD). The degree of shading represents the extent of LD. Darker shades indicate greater LD, lighter shades indicate less LD. When no number is shown within a box, and the box is dark gray, the corresponding D′ is 100 (complete linkage disequilibrium). a. European American samples; b. African American samples