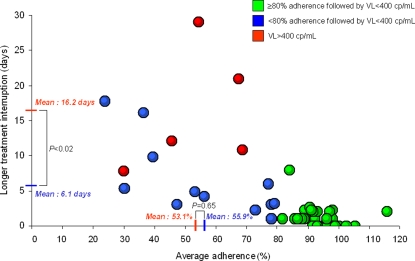
Figure 2. Relationship between average adherence and longer treatment interruption among subjects with (red) and without (green and blue) virologic rebound, POSOVIR and REACH cohorts.
- The red lines on the X and Y-axis correspond to mean average adherence (%) and treatment interruption duration (days), respectively, among subjects with subsequent HIV RNA≥400 copies/ml. The blue lines on the X and Y-axis correspond to mean average adherence (%) and treatment interruption duration (days), respectively, among subjects with subsequent HIV RNA<400 copies/ml and low-to-moderate adherence (<80%). The difference in treatment interruption duration, but not adherence rate, is statistically significant between those with HIV RNA≥400 copies/ml and those with HIV RNA<400 copies/ml.

