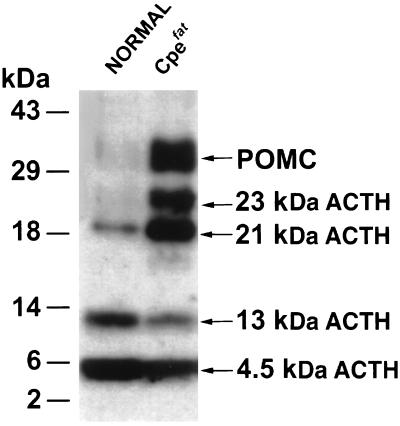
Figure 2.
Western blot of immunoreactive ACTH in anterior pituitary cells of normal and Cpefat mice. Protein (18 μg) from the cell extracts was applied in each lane for SDS/PAGE and Western blot analysis with DP4 antiserum. Molecular mass markers are shown on the left, and the various forms of ACTH are indicated on the right.

