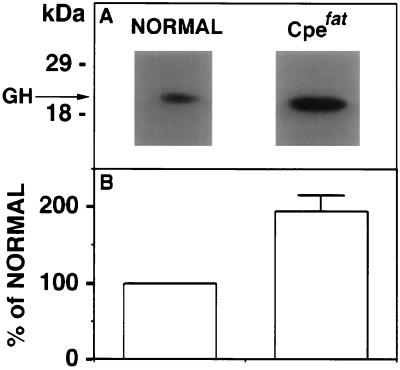
Figure 7.
(A) Western blot of GH in normal and Cpefat mice serum. GH is indicated by the arrow and molecular mass markers are shown on the left. (B) Bar graphs show the quantitation of serum GH in Cpefat mice from the Western blots expressed as a percentage of that present in serum of normal mice, which was made equal to 100%. The bar graph for Cpefat mice shows the mean percentage ± SEM of normal (194 ± 21; n = 4, P < 0.05).

