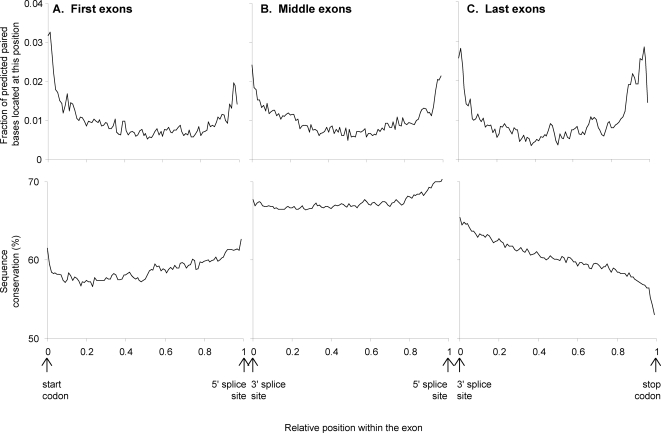
Figure 5. The pattern of sequence conservation near exon boundaries cannot explain the secondary structure peak just inside exon boundaries.
The relative position within the exon is plotted versus the fraction of predicted base-pairs and sequence conservation for a) 5′-most exons; b) internal exons; and c) 3′-most exons. The peak in predicted secondary structure inside the exon boundary is present regardless of whether sequence conservation rises or drops near the exon boundary.

