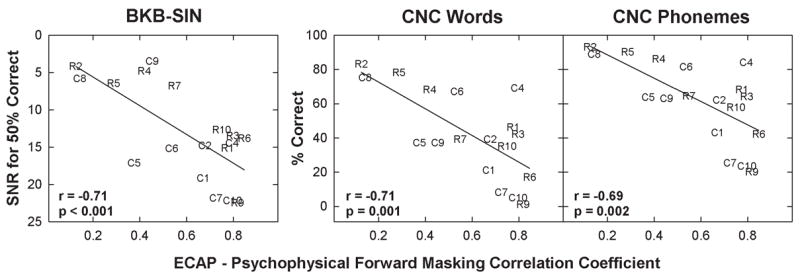
Fig. 7.

Speech-perception performance plotted relative to the correlation coefficient for the electrically evoked compound action potential forward masking (ECAP FM) versus psychophysical forward masking (PFM) comparison for all 18 subjects. Each panel represents data from a different speech perception measure: from left to right, Bamford-Kowal-Bench Sentences in Noise (BKB-SIN), Consonant-Nucleus-Consonant (CNC) words, and CNC phonemes. Solid lines represent linear regression results. Correlation coefficient and p-values are reported in each panel. SNR: signal-to-noise ratio.
