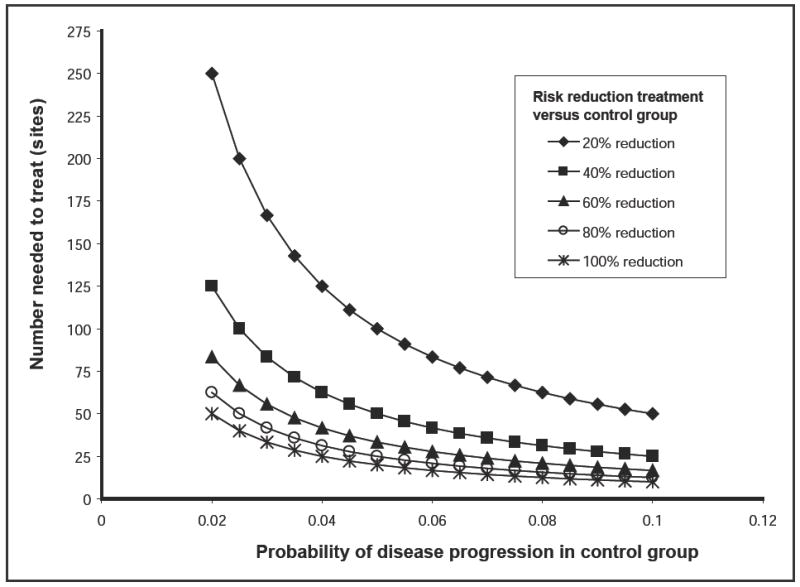
Figure 1.

Relation between the number of sites needed to treat and the probability of disease progression in the control arm under different sizes of treatment effect. The treatment effect sizes are expressed in terms of the reduction in risk of progression for the treatment group relative to the risk of progression for the control group.
