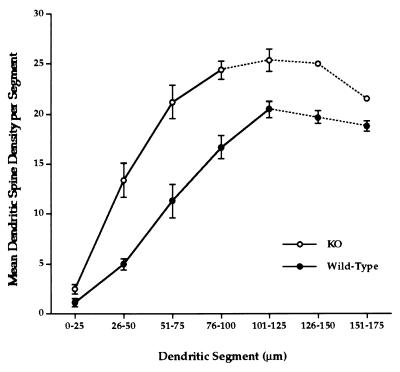
Figure 4.
Mean spine density (and SEM) distributions in fragile X knockout (KO) and wild-type mice. Overall spine density along apical dendrites of layer V pyramidal cells is significantly greater in knockout mice than in wild-type controls (F1,33 = 63.3, P < 0.0001). Dotted lines in graphs indicate reduced numbers of dendrites in the analysis due to some apical dendrites having been truncated by the section plane.

