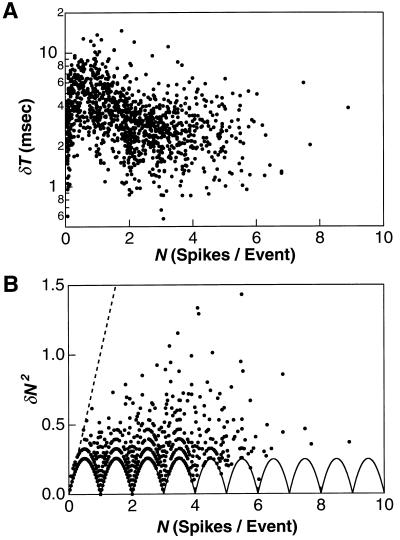
Figure 2.
Statistics of firing events for a salamander ganglion cell stimulated at 35% contrast. (A) The temporal jitter δT of the first spike versus the average spike count N in the event. (B) The variance in spike count δN2 versus the average spike count N. Each dot represents the precision of 1 of 1152 firing events accumulated during 30 repeated trials of an 800-sec segment of random flicker. The variance for a Poisson process is shown (broken line) along with the lower bound on the variance (solid line) arising from the fact that each trial generates an integer number of spikes.

