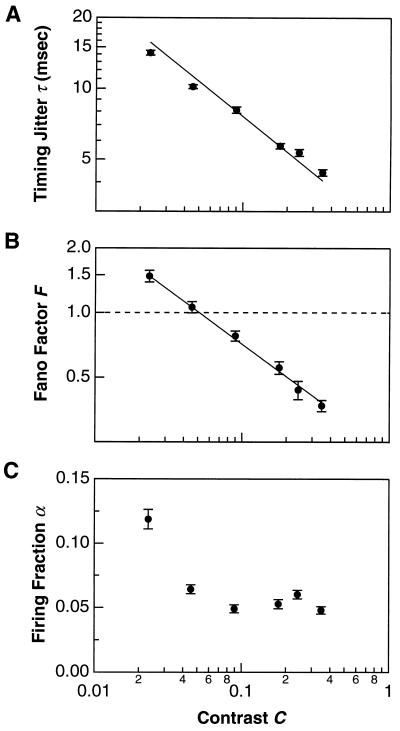
Figure 4.
Dependence of retinal precision on stimulus contrast. (A) The temporal jitter τ. (B) The Fano factor F. (C) The firing fraction α. All data (•) are plotted as mean ± SEM of a population of salamander ganglion cells (fast OFF-type), pooled over 50/6, 15/1, 31/3, 40/4, 31/3, and 32/3 cells/retinae at each contrast value ranging from highest to lowest. Solid lines are one-parameter curve fits proportional to Contrast−0.5.

