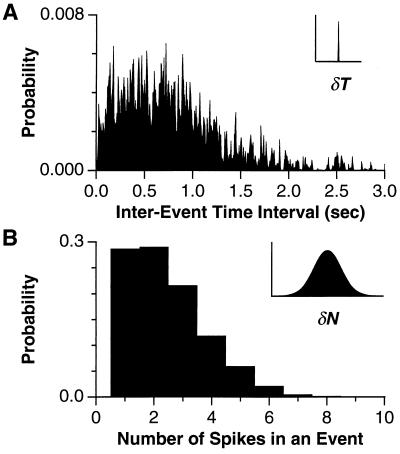
Figure 5.
Histogram of the distribution of (A) time intervals between the first spike of two consecutive firing events and (B) number of spikes in an event, accumulated over 30 trials of an 800-sec segment of random flicker for a salamander ganglion cell at 35% contrast. (Insets) For comparison on the same abscissa, a Gaussian distribution is shown with a standard deviation given by the median temporal jitter and number jitter, respectively.

